TOC
2017 was the year of the Software Defined Network (SDN). Apart from other things like new players jumping onto the SDN space and a bunch of new SD-WAN offerings, two prominent innovation leaders - Google and Facebook - both released blogs and papers on their software defined edge network. Google’s solution; named Espresso, is likely a more battle tested and production-hardened solution owning to years of R&D and testing. It is, however (or at least in my opinion) a lot more complex than Facebook’s Edge Fabric that uses a much simpler approach to solving the same problem - which is to overcome BGP’s inability to take link performance ( which translates to application performance) into account for its routing decisions.
While I was admittedly employed at Facebook during the work they did on Edge Fabric, I was not directly working on any parts of the solution myself, be it design, development or deployment. I did however, gain some high level exposure to the real world nuances and implications of deploying such systems into production. I thought it would be a fun little effort to implement a solution similar to Edge Fabric ( or rather a highly simplified, assumption driven, completely non production-worthy version of it ) given its simplicity compared to other alternatives. So in this two part series, I am going to explore the design and implementation of a software defined edge network modeled along the lines of Edge Fabric, complete with a sample (virtualized) topology, SDN controller and other components. Note that this exercise is meant to be a pure proof-of-concept demo, showing how a system like Edge Fabric could take shape in real production environments.
The Problem
Before diving into details, a quick recap on the problem that these systems attempt to solve. BGP only routes using best path information and path attributes. Thus it fails to account for link performance. An overutilized link or a link experiencing errors can quickly degrade application performance. Similarly, application traffic using a specific WAN edge link can suffer in the event of a downstream problem in the ISP’s network or anywhere else along the path. In all these scenarios, the router will happily continue to route the affected traffic based on BGP’s best path decision. An operator usually performs manual traffic engineering (TE) in response to signals from alerts or application owners. Of course at FB, GOOG, MSFT magnitude, this approach does not scale at all. Even when there is no network problem per se, an application should be able to potentially dictate the WAN path it wants to take.
In the past, hardware vendors like Cisco have attempted to solve this problem by trying to impart intelligence to routers ( remember PFRv1 ? ), which is the opposite of what the industry decided to do ( and for good reason ) - which was to use external software control to dictate the paths application traffic should take. After all, routers need to be made more dumb, not more intelligent ! There are a few ways in which this software control can be implemented. In each case, a controller decides, based on inputs such as QOS and link utilizations, which path specific host packets should take. Hosts are then told to influence the data path for every egress packet by using some crafty techniques:
- Push MPLS labels onto every packet that identifies the egress port on the edge/WAN routers (said label being determined by the controller). Of course this requires the OS to support MPLS switching, which introduces a new moving part with its own set of bugs and challenges.
- Tunnel packets to the edge routers using stuff like GRE with Key extensions or specific DSCP bits (again, controller derived), which the router matches using pre-set policies and chooses a specific routing instance, VRF or outgoing interface to route the decapsulated packet to.
The above host-induced per-packet source routing provides the ultimate granularity for routing application flows. However, the increased complexity of these solutions can make deployment and operations a nightmare. Another approach that is more suited to service provider topologies is to provide per-prefix control using techniques like Egress Peer Engineering. Most of these methods introduce dependencies on vendor feature sets and control planes. In order to decouple the path influencing logic from vendor control planes, one option is to use BGP injection - where specific higher preference paths are injected by a BGP controller in order to override BGP’s best path decisions. While I dont necessarily endorse one method over the other, (each one has its own merits and de-merits), I ended up using this method since it was the easiest to implement.
Setting the Stage
Our POC design will attempt to steer portions of traffic away from overloaded links on an edge router. While this does not provide complete application-driven edge control, it is a simplistic way of improving application performance by routing around overloaded links. We can think of the design as a simple closed-loop control system where a controller automatically regulates the output based on certain inputs, control variables and feedback from the output itself.

In our case, the inputs to the system are provided as below:
- Link utilizations (bps) that allow the controller to determine overloaded links
- Per-prefix utilizations (bps) that allow the controller to determine which prefixes to override
- Interface data either via SNMP or some other external source of truth
- Static configuration on interface high and low watermarks, thresholds etc.
Using these inputs, the controller determines if any prefixes need to be detoured and automatically regulates the ouput link utilizations by keeping them within the configured thresholds. The resulting interface utilization data is fed back into the controller so it can continue to make up-to-date decisions.
Network Topology
The virtualized network we will use for the demo will be a simple one comprising of two virtual devices connected back to back via two links. Each uplink on the edge switch serves to emulate an edge BGP peer. Normal BGP policy would dictate that ISP A (which could be a settlement-free peer) be preferred for all traffic over ISP B (or a transit provider) for various reasons (cost, business policy etc.). I chose a Cumulus VX switch running Cumulus Linux 4.12 as the edge device ( more on this choice later ). The peering device could be anything since its mostly passive. The only requirement is to be a BGP speaker. In this case, I used a Juniper vQFX10k. A couple of servers connect directly to the Cumulus VX for traffic generation and hosting the controller. I used Virtualbox coupled with Vagrant to build this setup. Although simple, this topology emulates a network edge where a an edge device peers with multiple WAN providers, such as a Bi-Lateral peer and a Transit provider.

All links are configured as 1Gbps by default. BGP is configured on the VQFX to announce several random prefixes downstream. Although the same prefix is received on the Cumulus over both links, BGP is configured to prefer the path via AS 33010 (using higher LocalPref) at all times for all prefixes. This will cause all traffic to those prefixes to always egress via the swp1 interface. In order to generate actual traffic, we can use a simple tool like iperf on one of the two servers. The next step is to start collecting data from the device.
Data Collection via Sflow
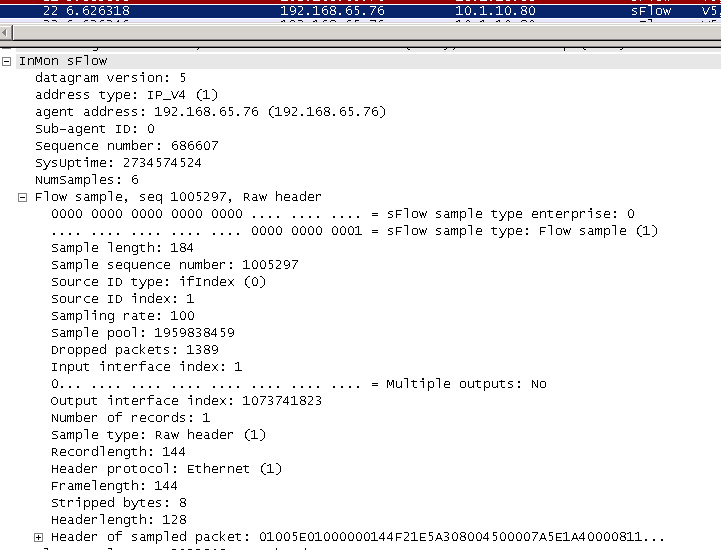
As mentioned above, we need a way to measure and collect interface utilizations and per-prefix utilizations to provide as input to our controller. We can collect link utilizations the old fashioned way - polling interface counters via SNMP or other mechanism. Per-prefix utilization is usually gleaned from flow data collected via Netflow or IPFIX. However, there is a (relatively) new star player in the traffic analytics field - Sflow. I wont go too deep into the differences between Netflow and Sflow but in a nutshell, Sflow is a protocol developed by InMon Corporation (RFC 3176) that has existed since the early 2000s and has recently gained quite some industry traction. It works by sampling 1 in N packets traversing an interface and exporting the packet header out to an Sflow collector. This is in contrast to Netflow which also samples packets but groups them into “flows” (src/dst ip, port) and exports them out as “flow records” instead. Sflow is relatively light-weight, simple and defines extensions that allow decorating each sampled packet with metadata such as switching information (vlans etc), routing information (bgp route, attribute and next-hop info) and others.
Another interesting aspect of Sflow is that it can also be configured to sample and export interface counters such as utilization and error counters , providing a light-weight ( usually chipset implemented ) alternative to traffic monitoring via SNMP polling, GRPC streaming and the likes. Because of this added functionality, it made the most sense for me to use Sflow export so I could use a single Sflow collector for both interface as well as per-prefix utilization.
Assuming a sample rate of 1 in N, an average packet size of B bytes, sampling interval of T seconds and if the number of samples in the interval T is n, the statistical rate of traffic can be found using:
bps = (n * N * B * 8) / T
All of this information is exported as part of the Sflow packet, along with the packet header itself which provides source/destination IP info. Also, a router can be configured to send the route information for a given destination ( specifically the next hop IP, the source and destination prefix mask lengths ) via the Sflow Router extension.Thus by grouping the destination IPs of the reported samples into prefixes ( based on route prefix-length obtained from the Router extension) and applying the above formula, the bps of each prefix can be determined over the given sampling interval.
Sflow also reports interface octet counts at periodic intervals. Interface utlization can be calculated simply by storing the rate of change of octets over the reporting interval and then computing the average rate over time.
To build the Sflow collector, I used the GoPacket library which provides packet parsing functionality for many different protocols and payloads. Interestingly, I ended up discovering a bug in the Sflow parsing code that I had to patch up locally to get things working :)
Besides just traffic statistics we would also need additional data about the device and all its interfaces ( such as names, SNMP ifIndex, speed etc.). While this would be normally fetched from a Source of Truth or an existing collection tool, in my case, it was sufficient to provide this information via a configuration file to the controller. Using a configuration file also allows for manipulating data to facilicate testing. For example, because I ran the whole testbed on my laptop, I could’nt push much traffic through the VMs without frying out my CPU; certainly not to the 1Gbps speeds the interfaces support. By using a configuration file, I can override the interface speeds to be, say, 100Mbps instead of 1 Gbps thereby allowing me to test the controller using much lower traffic rates.
Choosing a Router VM
When evaluating a vendor image to use as the device under test, the Sflow functionality was the main factor that drove my decision. I tried out a host of different vendor images until I finally settled on Cumulus VX:
- Arista vEOS (lab) : Supports Sflow functionalty only on L2 interfaces. It also would not export counters and samples accurately and constantly under-reported the values.
- Juniper vQFX : Requires a separate PFE image to get proper forwarding functionality. Also, interface counters are not properly reflected on the
xeinterfaces. - Cisco NxOS-V : This one was a heavyweight. It seemed to support full functionality but was very resource intensive. Push only a few MBs of traffic and my 8 core i9 laptop would struggle to keep up.
- Cumulus VX : This image, in conjunction with the host sflow daemon, was the only one that seemed to report accurate interface counters as well as sflow samples, albeit missing some functionality like router exension export. To get around this limitation, I had to assume an appropriate prefix mask as a default.
A quick note on host sflow
The Cumulus VX image comes pre-packaged with the host sflow daemon. This tool, apart from just exporting flow information and interface statistics, can also be configured to export a “host” of other host metrics (no pun intended) such as metrics for virtualized components, cpu/mem info and even application specific metrics. It supports a wide variety of OSs and platforms, including Arista EOS, SONiC and OpenSwitch.
By default, sampling only seems to work in the ingress direction on all interfaces. In order to get egress flow sampling working on the Cumulus VX, I had to use nflog based sampling combined with iptables post-routing rules. For example to configure egress packet sampling at a rate of 1 in 1000:
MOD_STATISTIC="-m statistic --mode random --probability 0.001"
NFLOG_CONFIG="--nflog-group 5 --nflog-prefix SFLOW"

sudo iptables -t mangle -I POSTROUTING -j NFLOG $MOD_STATISTIC $NFLOG_CONFIG
The host sflow daemon can then be configured to plug into nflog group 5 to receive the packet samples from the kernel:
sflow {
  collector { ip = 10.1.4.100 }
  nflog { group=5 probability=0.001 }
}
BGP Listener/Injector
The next major component that the collector requires is a BGP Injector. This needs to be a programmable BGP speaker that can peer with the edge device and expose an API that can send/withdraw routes on demand as well as provide a route query interface. In order to steer traffic from an overloaded interface to a non overloaded one, we need to know all possible paths for a given prefix and not just the best bath. When such information is needed, the BGP Monitoring Protocol (BMP) is typically used. However, in order to avoid setting up a BMP speaker in addition to a BGP injector, we can accomplish both tasks by configuring the edge router with the BGP additional-paths (Add-Paths) funcionality.
When it comes to implementing a programmable BGP interface, my tool of choice is GoBGP. Its GRPC based API makes it easy to add/delete routes on the fly and to configure advanced BGP functionality ( although it does take some getting used to, since the documentation is not super explicit ). You can also use GoBGP as a library, which is what our controller will do as well. The BGP implementation will serve two purposes:
- Provide info on all the available paths for a given prefix (via Add-Paths configured on the router) so that the controller is able to decide which alternate paths to use for a given prefix.
- Inject more specific prefixes of a higher preference to the router ( based on the above decision ) pointing to alternate interfaces so that a portion of traffic belonging to that prefix is detoured to alternate paths.
I opted to integrate GoBGP into the controller code because this allows greater control over manipulating the BGP daemon. Here is what the GoBGP config would look like for our use case, if we were to run this as a standalone daemon instead. You can see how we specify the conditional route announcement policies on a per-neighbor basis:
[global.config]
    as = 1
    router-id = "1.1.1.1"

    [global.apply-policy.config]
        default-import-policy = "accept-route"
        export-policy-list = ["route-announce"]
        default-export-policy = "accept-route"

[[neighbors]]
    [neighbors.config]
        peer-as = 2
        neighbor-address = "192.168.10.2"

[[defined-sets.neighbor-sets]]
   neighbor-set-name = "r1"
   neighbor-info-list = ["192.168.10.2"]
[[defined-sets.bgp-defined-sets.community-sets]]
    community-set-name = "announce"
    community-list = ["100:100"]
[[policy-definitions]]
    name = "route-announce"
    [[policy-definitions.statements]]
        [policy-definitions.statements.conditions.match-neighbor-set]
            neighbor-set = "r1"
            match-set-options = "all"
        [policy-definitions.statements.conditions.bgp-conditions.match-community-set]
            community-set = "announce-to-r1"
            match-set-options = "all"
Controller
Finally, we have the controller that is the brains of the system. The controller uses data from the Sflow collector to determine overloaded interfaces, figures out prefixes that could be detoured and instructs the BGP daemon to inject alternate paths to detour traffic off the overloaded links. Because this is a POC, we will keep the controller fairly simple:
- A configuration file specifies, among other things:
- A list of interfaces to monitor
- A list of alternate interfaces to detour traffic to
- High and low watermarks ( in percentages ) when traffic detours should be added and removed.
- Stuff that will normally be fetched via other means (interface IPs, SNMP index, speed)
- Periodically monitor the interfaces specified in a configuration file for traffic rates.
- If traffic percentage goes above the high watermark, trigger a traffic detour.
- Query the SFlow collector for the top 5 prefixes sending traffic across the overloaded interface
- It is possible that a given prefix takes up a large portion of traffic across an interface. If we attempt to detour all traffic for such a prefix, we may end up overloading the alternate link instead ! Thus we will implement logic that will split a “large” prefix into smaller subnets (e.g /24 into two /25s) recursively until we find a prefix “small” enough to detour. This per-prefix threshold will be determined by a configurable parameter.
- Query the BGP daemon for all available paths for the candidate prefixes.
- Instruct the BGP daemon to inject the candidate prefixes with higher preferences onto alternate paths one by one until the interface utilization goes below the low watermark.
- Keep a track of all overrides added for an interface. If the utilization of a monitored interface goes below the low watermark, delete the previous detours ( i.e withdraw the overriden prefixes ) while ensuring that traffic still stays below the high watermark.

With the above components hashed out, our high level controller design can be now visualized as follows.

Note that in practice, it makes sense to deploy each component as its own individual service. Thus the Sflow collector, BGP daemon and the actual controller would be three separate applications. The advantage of this is that each component could be individually iterated for bug fixes, feature adds etc. without impacting the others. For example, the controller could be taken down for an upgrade while the BGP daemon still continues to announce detour prefixes to the routers. Of course nothing is free - the disadvantage of this approach is there would now be a need to introduce idempotency ( either at the controller or the BGP daemon or both ) by some other means thereby making the design of these components more complex.
Once again, to keep things simple, I opted to integrate all three controller components into the same binary. Even though this means that any application restart would result in interfaces getting overloaded again ( since the injected BGP routes are also lost ), it allows us to keep the code simple - and the detours would be placed back again once the application starts back up. Another controller choice is one of stateless vs stateful design. This is usually a choice that involves some tradeoff - usually one of increased code complexity to achieve more operational simplicity. In my opinion, maintaining some state is ok if it allows you to keep the code simple and maintainable, so long as fixtures exist to expose operational state for debugging purposes. Thus our controller maintains its override decisions in memory and exposes a REST API that provides insight into that state.
With that said, the full controller code, along with the Vagrant demo environment is found here : https://github.com/mayuresh82/edge-traffic-controller . In part 2 of this series, we will see the controller in action by simulating actual traffic flows and looking into its operation in more detail !
References
- Facebook Edge Fabric: https://research.fb.com/wp-content/uploads/2017/08/sigcomm17-final177-2billion.pdf
- Host Sflow: https://sflow.net/about.php
comments powered by Disqus