TOC
In Part 1 of this series, we ran through the technical details of what it would take to build an edge traffic controller to steer traffic away from overloaded edge links. In this blog, I will try to demonstrate the controller in action by simulating traffic flows using our virtualized topology. We will also look into other real world considerations such as operational monitoring and metrics.
Initial Setup
To recap, this is what our topology looks like:

BGP setup
Recall that the Juniper vQFX is setup as a peer router in our topology and is configured to announce several random prefixes such as 1.0.0.0/24, 1.0.1.0/24 etc to the downstream Cumulus VX. These prefixes will be installed as sink routes with a discard ( or null0) next hop which means the UDP traffic to these destinations is simply going to get dropped. The vQFX will be configured to announce the same routes across both BGP sessions to the Cumulux which will then be configured to prefer the route over the “peering” link as opposed to the “transit” link. This device will also establish an iBGP peering session with the controller and will announce additional all paths to it (while retaining the external next hops). Below is a BGP configuration snippet from the Cumulux VX:
router bgp 12121
  bgp router-id 50.50.50.50
  neighbor 10.1.4.100 remote-as 12121
  neighbor 10.1.4.100 description CONTROLLER
  neighbor 172.16.0.0 remote-as 33010
  neighbor 172.16.0.0 description PEER
  neighbor 172.16.0.2 remote-as 42428
  neighbor 172.16.0.2 description TRANSIT
  neighbor 172.16.0.0 timers 0 0
  neighbor 172.16.0.2 timers 0 0

  address-family ipv4 unicast
    network 10.1.3.0/24
    network 10.1.4.0/24
    neighbor 10.1.4.100 addpath-tx-all-paths
    neighbor 10.1.4.100 route-map ALL out
    neighbor 172.16.0.0 soft-reconfiguration inbound
    neighbor 172.16.0.0 route-map PEER_IN in
    neighbor 172.16.0.2 soft-reconfiguration inbound

route-map PEER_IN permit 10
  set local-preference 200

route-map ALL permit 10
Below is a snippet from the route table of the Cumulus VX, which shows the same route being announced from both neighbors, while the route to the peer being preferred:
vagrant@rtr1:mgmt:~$ net show bgp
show bgp ipv4 unicast
=====================
BGP table version is 239, local router ID is 50.50.50.50, vrf id 0
Default local pref 100, local AS 12121
Status codes:  s suppressed, d damped, h history, * valid, > best, = multipath,
               i internal, r RIB-failure, S Stale, R Removed
Nexthop codes: @NNN nexthop's vrf id, < announce-nh-self
Origin codes:  i - IGP, e - EGP, ? - incomplete

   Network          Next Hop            Metric LocPrf Weight Path
*  1.0.0.0/24       172.16.0.2                             0 42428 i
*>                  172.16.0.0                    200      0 33010 i
*  1.0.1.0/24       172.16.0.2                             0 42428 i
*>                  172.16.0.0                    200      0 33010 i
*  1.0.2.0/24       172.16.0.2                             0 42428 i
*>                  172.16.0.0                    200      0 33010 i
*  1.0.3.0/24       172.16.0.2                             0 42428 i
*>                  172.16.0.0                    200      0 33010 i
*  1.0.4.0/24       172.16.0.2                             0 42428 i
*>                  172.16.0.0                    200      0 33010 i
Host sflow setup
In order to correctly sample egress packets on the Cumulus VX, we need to enable nflog sampling at a rate of 1 in 1000 packets using iptables post-routing rules as follows:
MOD_STATISTIC="-m statistic --mode random --probability 0.001"
NFLOG_CONFIG="--nflog-group 5 --nflog-prefix SFLOW"

sudo iptables -t mangle -I POSTROUTING -j NFLOG $MOD_STATISTIC $NFLOG_CONFIG
sudo iptables -t mangle -I INPUT -j NFLOG $MOD_STATISTIC $NFLOG_CONFIG
The host sflow daemon on the Cumulus VX can then be configured to export flows to the controller. Below is the relevant host-sflow daemon config:
sflow {
  agent = swp4
  polling = 10
  sampling = 1000
  collector { ip=10.1.4.100 udpport=6343 }
  nflog { group = 5  probability = 0.001 }
}
This hsflowd config specifies flow export to agent IP 10.1.4.100 using a sampling rate of 1 in 1000 packets. It is set to poll and export interface counters every 10 seconds using the address of interface swp4 as the source ip. We also configure the daemon to use nflog group 5 (defined above) with a probability that matches the sampling rate.
Finally, we can start the hsflow daemon using:
sudo service hsflowd start
Controller setup
The controller needs to be supplied with a config file that specifies the device and interfaces to be monitored, as well as the potential detour candidate links. For the demo, we will also specify interface parameters such as link speed, SNMP index etc using the same config file. The following is the YAML config we will use:
sflow:
  listen_port: 6343
  counter_poll_interval: 10s

bgp:
  local_as: 12121
  local_ip: 10.1.4.100

devices:
  - name: rtr1
    ip: 10.1.4.1
    asn: 12121
    bgp_community: 100:100
    interfaces:
      - name: swp1
        ifindex: 3
        address: 172.16.0.1/31
        speed: 100000000
        high_watermark: 80
        low_watermark: 65
        per_prefix_threshold: 30000000
        #dry_run: true
        monitor: true
      - name: swp2
        ifindex: 4
        address: 172.16.0.3/31
        speed: 100000000
        high_watermark: 80
        low_watermark: 60
First we specify the sflow port and the expected counter poll interval. Next comes the BGP config for the embedded GoBGP server inside the controller. At the device level, we specify the BGP parameters to use. Each device is configured with a special BGP community, which is used by GoBGP to perform selective route announcement (via peer policies) to that specific neighbor. Also note that the device ASN is the same as our controller ASN, which means we are using iBGP. This causes the router to announce prefixes with the original external next hops retained (i.e no next-hop-self). This is a crucial part of controller operation - since the controller needs visibility into external next hops in order to make detour routing decisions.
Interface swp1 is the interface connecting to our peering partner , which is AS 33010. Interface swp2 on the other hand connects to or transit provider, which is AS 42428. The monitored interface also specifies three noteworthy parameters:
- high_watermark: the utilzation percentage above which detours should be triggered
- low_watermark: the utilization percentage below which detours can be removed
- per_prefix_threshold: the per-prefix utilization in bps above which prefixes with high traffic rates need to be split into smaller prefixes. This is set to 30Mbps. The controller is thus configured to maintain the utilization between 60% to 80%. Also note the dry-run option which is set to False. IF this is set to True, the controller will simply log its decisions instead of actually applying the detours. Finally, we cap the interface speeds to 100Mbps in order to facilitate testing with reasonable traffic rates.
We can fire up the controller on srv2 and watch BGP come up with the router (rtr1):
vagrant@server2:~$ sudo ./controller -v=4 -logtostderr -config config.yaml
I0321 06:09:40.712404   15107 controller.go:90] Starting GoBGP Server
I0321 06:09:40.713107   15107 controller.go:100] Starting Sflow server on :6343
INFO[0000] Add a peer configuration for:10.1.4.1         Topic=Peer
I0321 06:09:40.714226   15107 controller.go:187] Starting http server on :8080
I0321 06:09:40.714315   15107 controller.go:223] Starting monitoring for Interface swp1 on rtr1
INFO[0006] Peer Up                                       Key=10.1.4.1 State=BGP_FSM_OPENCONFIRM Topic=Peer
I0321 06:09:47.048734   15107 controller.go:107] Peer rtr1 is now up !
The controller is now ready to receive sflow samples and start monitoring the interface swp1.
Traffic generation
We can use iperf installed on one of the servers attached to our Cumulus VM as a traffic generator. Iperf allows us to generate simple UDP streams with a given throughput and for a given duration to specific destination IPs. This is called client mode. Because our main goal here is to simply create some traffic load over our edge links without worrying about what happens to these streams, we dont really care about setting up iperf in server mode on the receiving end. In order to facilitate testing, I’ll be using a short Python script that can spin up subprocesses running iperf to a given destination at a given rate of traffic, in parallel.
Monitoring
In order to better monitor the effects of the controller on the edge interfaces, the controller offers a REST API that exposes useful operational information such as:
- utilization of interfaces being monitored
- top-N prefixes in terms of interface utilization
- current overrides that are in effect
- BGP paths learnt from the routers
Providing above APIs is a great way to ensure visibity into the operational state of the controller. Taking this a step further, the controller also exposes a Prometheus scrape endpoint that serves interface traffic statistics as well as per-prefix statistics obtained from Sflow samples. For the purposes of this demo, this can help visualize the effects of controller actions. We also stand up a local Grafana instance to create some lovely dashboards to go with this.
To start generating some traffic, lets go ahead and start up three UDP streams from srv1 to destinations 1.0.0.1, 2.0.0.1 and 3.0.0.1, each sending 20Mbps. Note that our HWM is set to 80Mbps and the LWM is set to 65% utilization for interface swp1. Watching the controller logs, we can see it monitoring the traffic utilizations every minute:
I0321 06:10:40.714529   15107 controller.go:240] rtr1/swp1 (Util: 45446361, speed: 100000000) is at 45% utilization
I0321 06:10:40.714785   15107 controller.go:246] Low WM reached for rtr1/swp1
I0321 06:10:40.714941   15107 controller.go:223] Starting monitoring for Interface swp1 on rtr1
I0321 06:11:40.715295   15107 controller.go:240] rtr1/swp1 (Util: 55628467, speed: 100000000) is at 55% utilization
I0321 06:11:40.715491   15107 controller.go:246] Low WM reached for rtr1/swp1
I0321 06:11:40.715641   15107 controller.go:223] Starting monitoring for Interface swp1 on rtr1
I0321 06:12:40.755906   15107 controller.go:240] rtr1/swp1 (Util: 65814520, speed: 100000000) is at 65% utilization
I0321 06:12:40.755917   15107 controller.go:246] Low WM reached for rtr1/swp1
I0321 06:12:40.755923   15107 controller.go:223] Starting monitoring for Interface swp1 on rtr1
I0321 06:13:40.756138   15107 controller.go:240] rtr1/swp1 (Util: 65806368, speed: 100000000) is at 65% utilization
I0321 06:13:40.756362   15107 controller.go:246] Low WM reached for rtr1/swp1
I0321 06:13:40.756674   15107 controller.go:223] Starting monitoring for Interface swp1 on rtr1
Even though we ask iperf to send 20Mbps streams, the actual measured traffic rate includes header overhead and as a result, the interface utilization settles at 65%.
After waiting a few minutes for counters to catch up and flow samples to populate, we start a fourth stream; this time of 25Mbps sending traffic to 4.0.0.1. A few minutes later, the utilization on interface swp1 hits the HWM and we can see the controller override in action:
I0321 06:16:40.917430   15107 controller.go:240] rtr1/swp1 (Util: 82609935, speed: 100000000) is at 82% utilization
I0321 06:16:40.923359   15107 controller.go:294] Final Prefixes: [[{4.0.0.0/24 29107200}] [{2.0.0.0/24 21830400}] [{1.0.0.0/24 21628266}] [{3.0.0.0/24 19404800}]]
I0321 06:16:40.923414   15107 controller.go:302] Will detour Prefix: {4.0.0.0/24 29107200}
I0321 06:16:40.923524   15107 controller.go:400] Adding overrides for device: rtr1, intf: swp1
I0321 06:16:40.925620   15107 controller.go:415] Found 3 total paths for prefix 4.0.0.0/24
I0321 06:16:40.925681   15107 controller.go:439] Detouring prefix 4.0.0.0/24 to interface swp2 (nh 172.16.0.2)
I0321 06:16:40.926163   15107 controller.go:315] Detouring total of 29107200 bps off interface rtr1:swp1 (util 82609935, hwm 80)
From the logs, we can see the controller logic in action. When it measures the interface utilization to be above the HWM, it first queries the Sflow collector and gets a list of the top 5 prefixes sending traffic across the interface. It then detours those prefixes one by one until the interface utilization falls below the HWM. In this case, the topmost prefix was 4.0.0.0/24 which had a utilization of 25Mbps (actual ~29Mbps) which gets detoured to the alternate path. This happens via injection of a BGP override to rtr1 with the same route but pointing to interface swp2 (next-hop 172.16.0.2) and with a higher local preference of 500. Checking the BGP table on rtr1 shows us this route:
*> 4.0.0.0/16       172.16.0.2                             0 42428 i
*>i4.0.0.0/24       172.16.0.2                    500      0 e
*                   172.16.0.0                    200      0 33010 i
*                   172.16.0.2                             0 42428 i
*> 4.0.1.0/24       172.16.0.0                    200      0 33010 i
*                   172.16.0.2                             0 42428 i
*> 4.0.2.0/24       172.16.0.0                    200      0 33010 i
*                   172.16.0.2                             0 42428 i
*> 4.0.3.0/24       172.16.0.0                    200      0 33010 i
*                   172.16.0.2                             0 42428 i
If we query the REST API in the controller, we can get all the information relevant to the current state of affairs. For one, we can see the current overrides in the controller. his includes information about the prefix being overriden along with its traffic rate as well as the injected BGP route.
$ curl "http://localhost:8080/api/overrides/?router=rtr1&interface=swp1"
{"4.0.0.0/24":{"Prefix":"4.0.0.0/24","rate":24458133,"parent_prefix":"4.0.0.0/24","Route":{"Prefix":"4.0.0.0/24","Nh":"172.16.0.2","Lp":500,"as_path":[42428],"Origin":1,"Med":0,"bgp_type":0,"Communities":["100:100"],"mp_candidate":false},"out_ifindex":4}}
We can also query the topK prefix rates across interfaces as shown below:
$ curl "http://localhost:8080/api/topK/?router=rtr1&interface=swp1"
[{"Prefix":"3.0.0.0/24","RateBps":24053866},{"Prefix":"1.0.0.0/24","RateBps":20415466},{"Prefix":"2.0.0.0/24","RateBps":19404800}]

$ curl "http://localhost:8080/api/topK/?router=rtr1&interface=swp2"
[{"Prefix":"4.0.0.0/24","RateBps":25873066}]
After waiting a few minutes, we shut off the 25Mbps traffic stream destined to 4.0.0.1 which naturally causes the interface util to fall to the LWM. The controller detects this and removes the override:
I0321 06:22:40.958804   15107 controller.go:240] rtr1/swp1 (Util: 65814866, speed: 100000000) is at 65% utilization
I0321 06:22:40.958839   15107 controller.go:246] Low WM reached for rtr1/swp1
I0321 06:22:40.958860   15107 controller.go:261] Removing previous override: {4.0.0.0/24 29843056}
I0321 06:22:40.959048   15107 controller.go:266] Adding back total 29843056 bps
I0321 06:22:40.959066   15107 controller.go:460] Removing override: 4.0.0.0/24 -> 172.16.0.2
I0321 06:22:40.959232   15107 controller.go:223] Starting monitoring for Interface swp1 on rtr1
The entire sequence of events above can be nicely visualized using our Grafana dashboards:
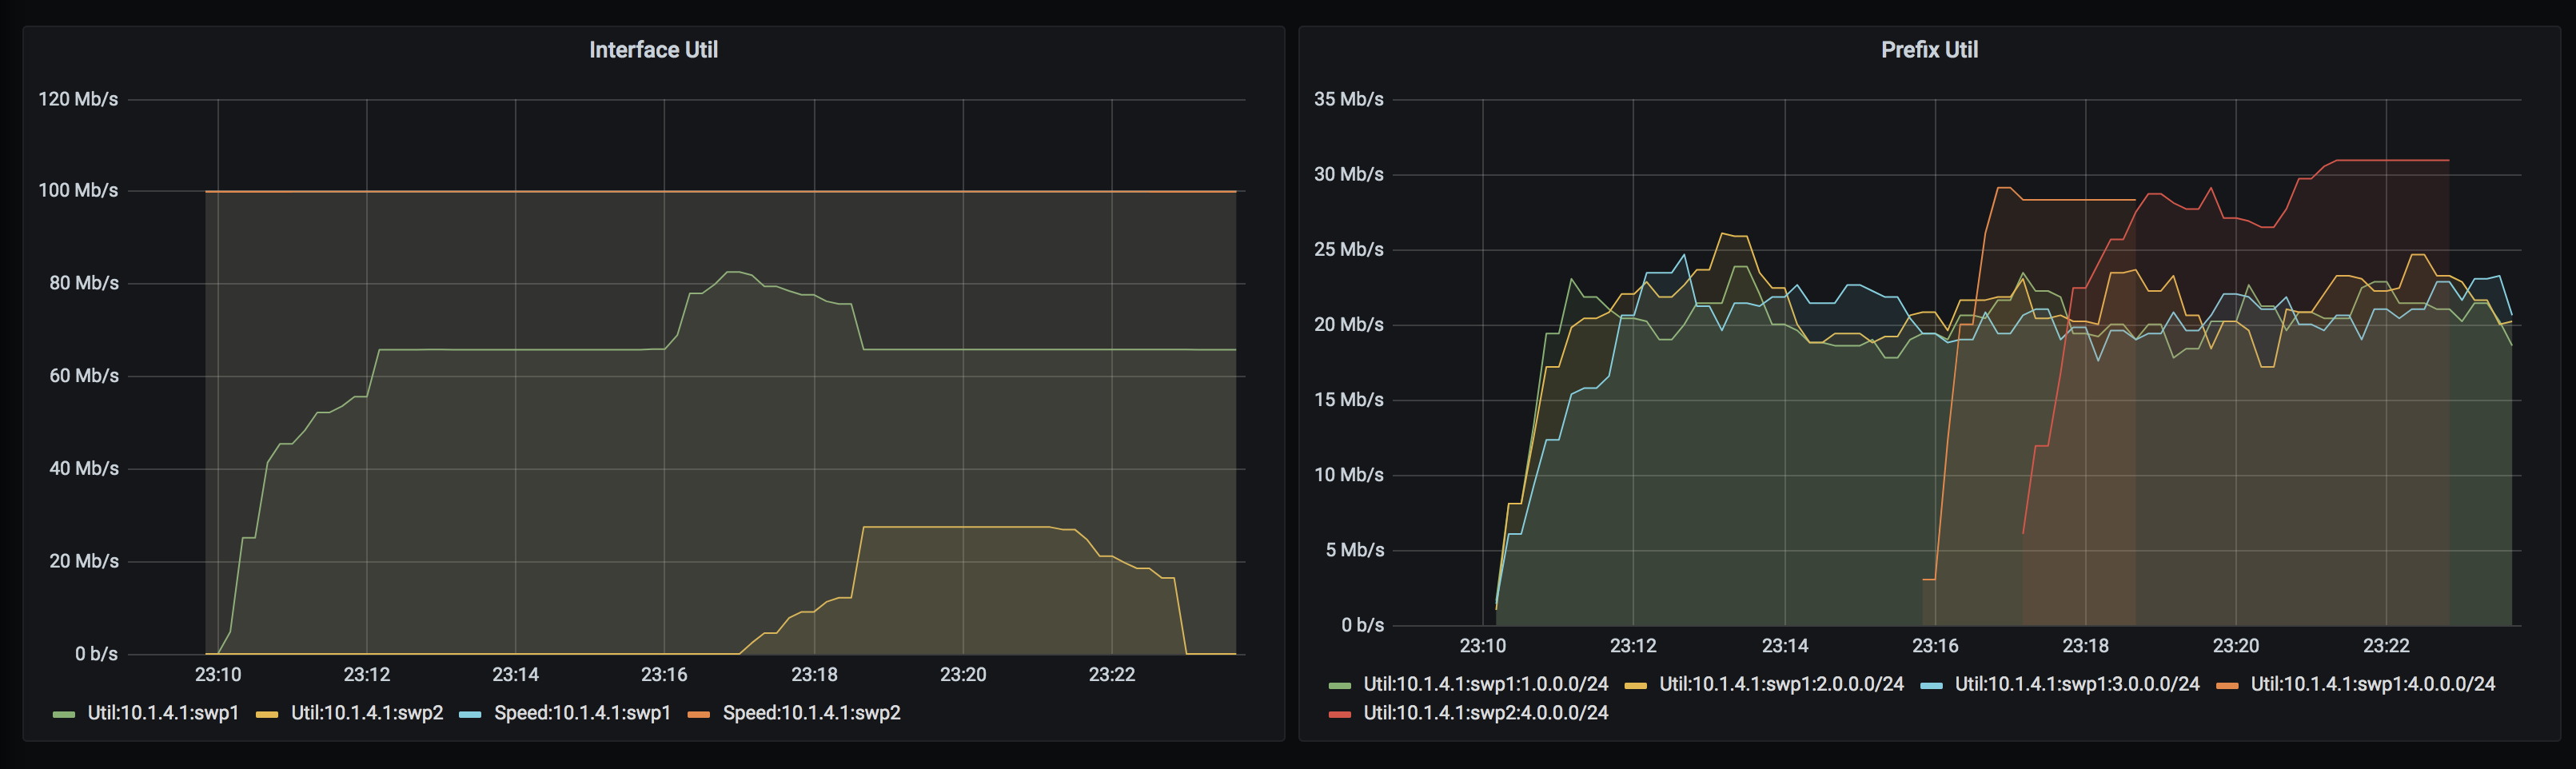
The first panel shows interface utilizations and speeds. You can see at the utilization of swp1 climbing up at 23:16 and hitting the HWM of 80Mbps. Right after at 23:17, the extra traffic spills over to the detour interface swp2 while utilization on swp1 gets normalized back to ~65Mbps. At 23:23, the extra traffic is removed.
The second panel shows per-prefix utilizations. Initially, we start the three 20Mbps streams which continue on for the duration of the test. At 23:16, 25Mbps of additional traffic to 4.0.0.0/24 (over swp1) is introduced (the orange timeseries). A minute later, this traffic moves over to swp2 in the form of the red timeseries. As you can imagine, visualization is a great way to capture effects of network controllers.
Prefix Splitting
For the second part, we will try and test the prefix-splitting functionality of the controller. In order to facilitate this, we will generate the following traffic streams from srv1:
- 20Mbps each to hosts 1.0.0.1, 1.0.0.129 and 1.0.0.193
- 20Mbps to host 2.0.0.1
- 10 Mbps to host 2.0.0.129
This gives us the following traffic distribution broken down by aggregate prefix:
- 60Mbps for 1.0.0.0/24
- 30Mbps to prefix 2.0.0.0/24
These streams cumulatively cause the traffic to exceed the HWM. Lets check the controller logs and the override decisions being made:
I0321 20:29:55.215899   17691 controller.go:240] rtr1/swp1 (Util: 99181451, speed: 100000000) is at 99% utilization
I0321 20:29:55.218543   17691 controller.go:294] Final Prefixes: [[{1.0.0.0/25 19606933} {1.0.0.128/26 23649600} {1.0.0.192/26 19000533}] [{2.0.0.0/25 23245333} {2.0.0.128/25 21723733}]]
I0321 20:29:55.218585   17691 controller.go:302] Will detour Prefix: {1.0.0.0/25 19606933}
I0321 20:29:55.218786   17691 controller.go:400] Adding overrides for device: rtr1, intf: swp1
I0321 20:29:55.219900   17691 controller.go:415] Found 3 total paths for prefix 1.0.0.0/25
I0321 20:29:55.219951   17691 controller.go:439] Detouring prefix 1.0.0.0/25 to interface swp2 (nh 172.16.0.2)
I0321 20:29:55.220442   17691 controller.go:315] Detouring total of 19606933 bps off interface rtr1:swp1 (util 99181451, hwm 80)
I0321 20:29:55.220479   17691 controller.go:223] Starting monitoring for Interface swp1 on rtr1
$ curl "http://localhost:8080/api/overrides/?router=rtr1&interface=swp1"
{"1.0.0.0/25":{"Prefix":"1.0.0.0/25","rate":19606933,"parent_prefix":"1.0.0.0/24","Route":{"Prefix":"1.0.0.0/25","Nh":"172.16.0.2","Lp":500,"as_path":[42428],"Origin":1,"Med":0,"bgp_type":0,"Communities":["100:100"],"mp_candidate":false},"out_ifindex":4}}
Since the top prefix in terms of traffic is 1.0.0.0/24 with a cumulative rate of 60Mbps, and our per-prefix threshold is set to 30Mbps, the controller splits this prefix in two passes. The first splits the /24 into two /25s (1.0.0.0/25, 1.0.0.128/25) with traffic rates of (20Mbps, 40Mbps). Since the second /25 prefix is still above the threshold of 30 Mbps, it is further split into two /26s (1.0.0.128/26, 1.0.0.192/26) with traffic rates of (20Mbps, 20Mbps). At this point, everything is within the threshold so the splitting logic returns the final set of prefixes. The controller then detours 20Mbps of traffic for prefix 1.0.0.0/25 as can be seen in the above logs as well as in the BGP table of rtr1:
vagrant@rtr1:mgmt:~$ net show bgp
show bgp ipv4 unicast
=====================
BGP table version is 426, local router ID is 50.50.50.50, vrf id 0
Default local pref 100, local AS 12121
Status codes:  s suppressed, d damped, h history, * valid, > best, = multipath,
               i internal, r RIB-failure, S Stale, R Removed
Nexthop codes: @NNN nexthop's vrf id, < announce-nh-self
Origin codes:  i - IGP, e - EGP, ? - incomplete

   Network          Next Hop            Metric LocPrf Weight Path
*> 1.0.0.0/16       172.16.0.2                             0 42428 i
*  1.0.0.0/24       172.16.0.2                             0 42428 i
*>                  172.16.0.0                    200      0 33010 i
*>i1.0.0.0/25       172.16.0.2                    500      0 e
*  1.0.1.0/24       172.16.0.2                             0 42428 i
*>                  172.16.0.0                    200      0 33010 i
*  1.0.2.0/24       172.16.0.2                             0 42428 i
*>                  172.16.0.0                    200      0 33010 i
*  1.0.3.0/24       172.16.0.2                             0 42428 i
*>                  172.16.0.0                    200      0 33010 i
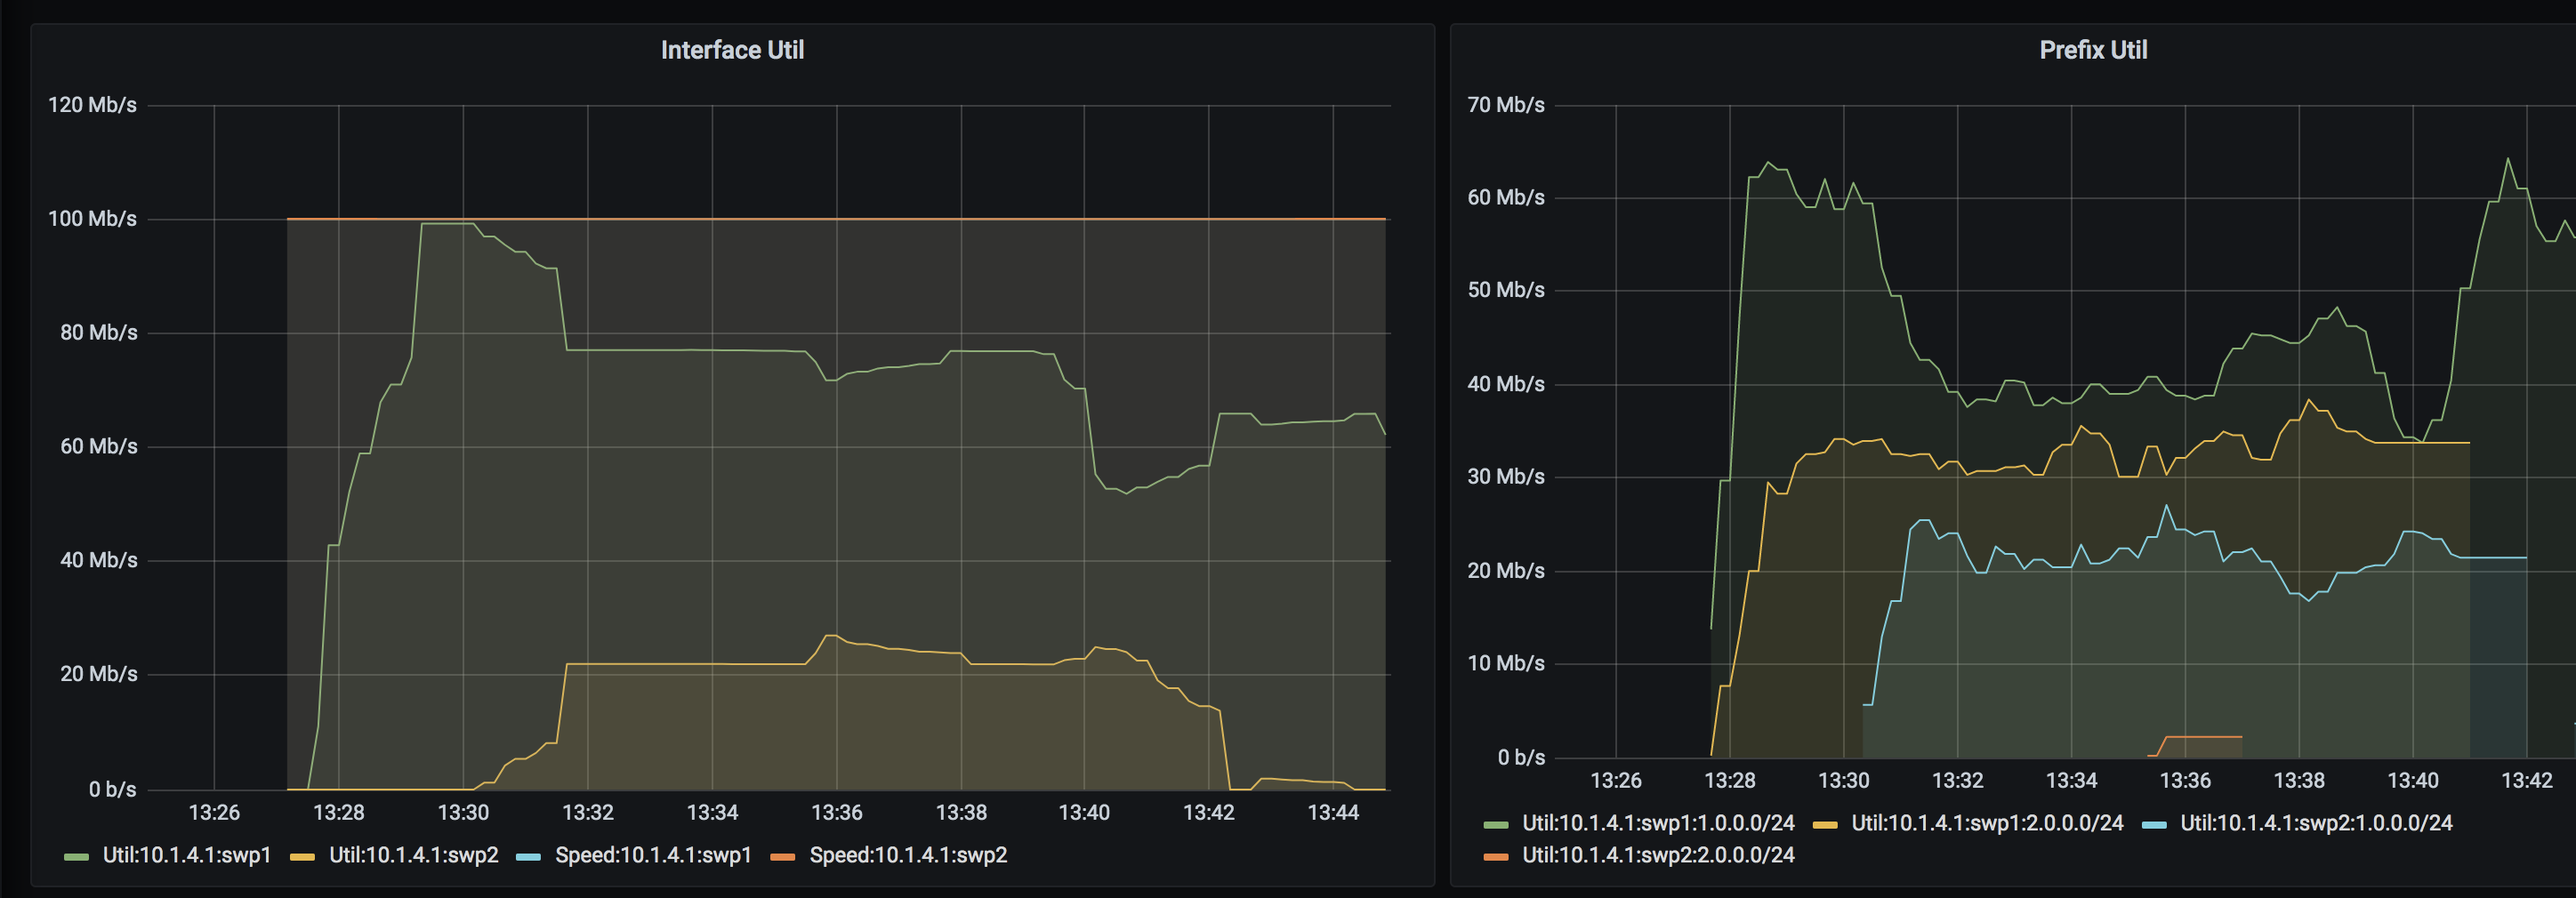
Our Grafana dashboards also reflect all the above decisions. Note that the per-prefix dashboards still only show the aggregate /24 prefixes due to a limitation with the host sflow daemon on the Cumulux VX that does not export route table extensions. We can also see that one of the prefixes in the 2.0.0.0/24 range was detoured for a short amount of time. In general, detours will be added and removed as counters get updated and the controller gets enough flow data to reach a steady state.
Final thoughts
While the controller we designed works pretty well and as intended in a heavily simulated and fabricated environment, real world deployments are a whole different ball game :) Often times, traffic patterns and application behaviors will end up governing and influencing controller development over time. Even though you may see the traffic being correctly detoured, your applications may still experience issues that may lead you to question the validity of controller decisions. This is true for not just simple BGP injection based detours but also for the more complicated controller designs involving MPLS and such. This simple yet effective Proof-of-Concept design does prove however, that centralized software based control is a great way to ensure that the network ends up as nothing more than a commodity that your applications can leverage to help drive your business goals and decisions.
Read Part 1 here : https://mayuresh82.github.io/2021/02/23/edge-controller-part1/
comments powered by Disqus